


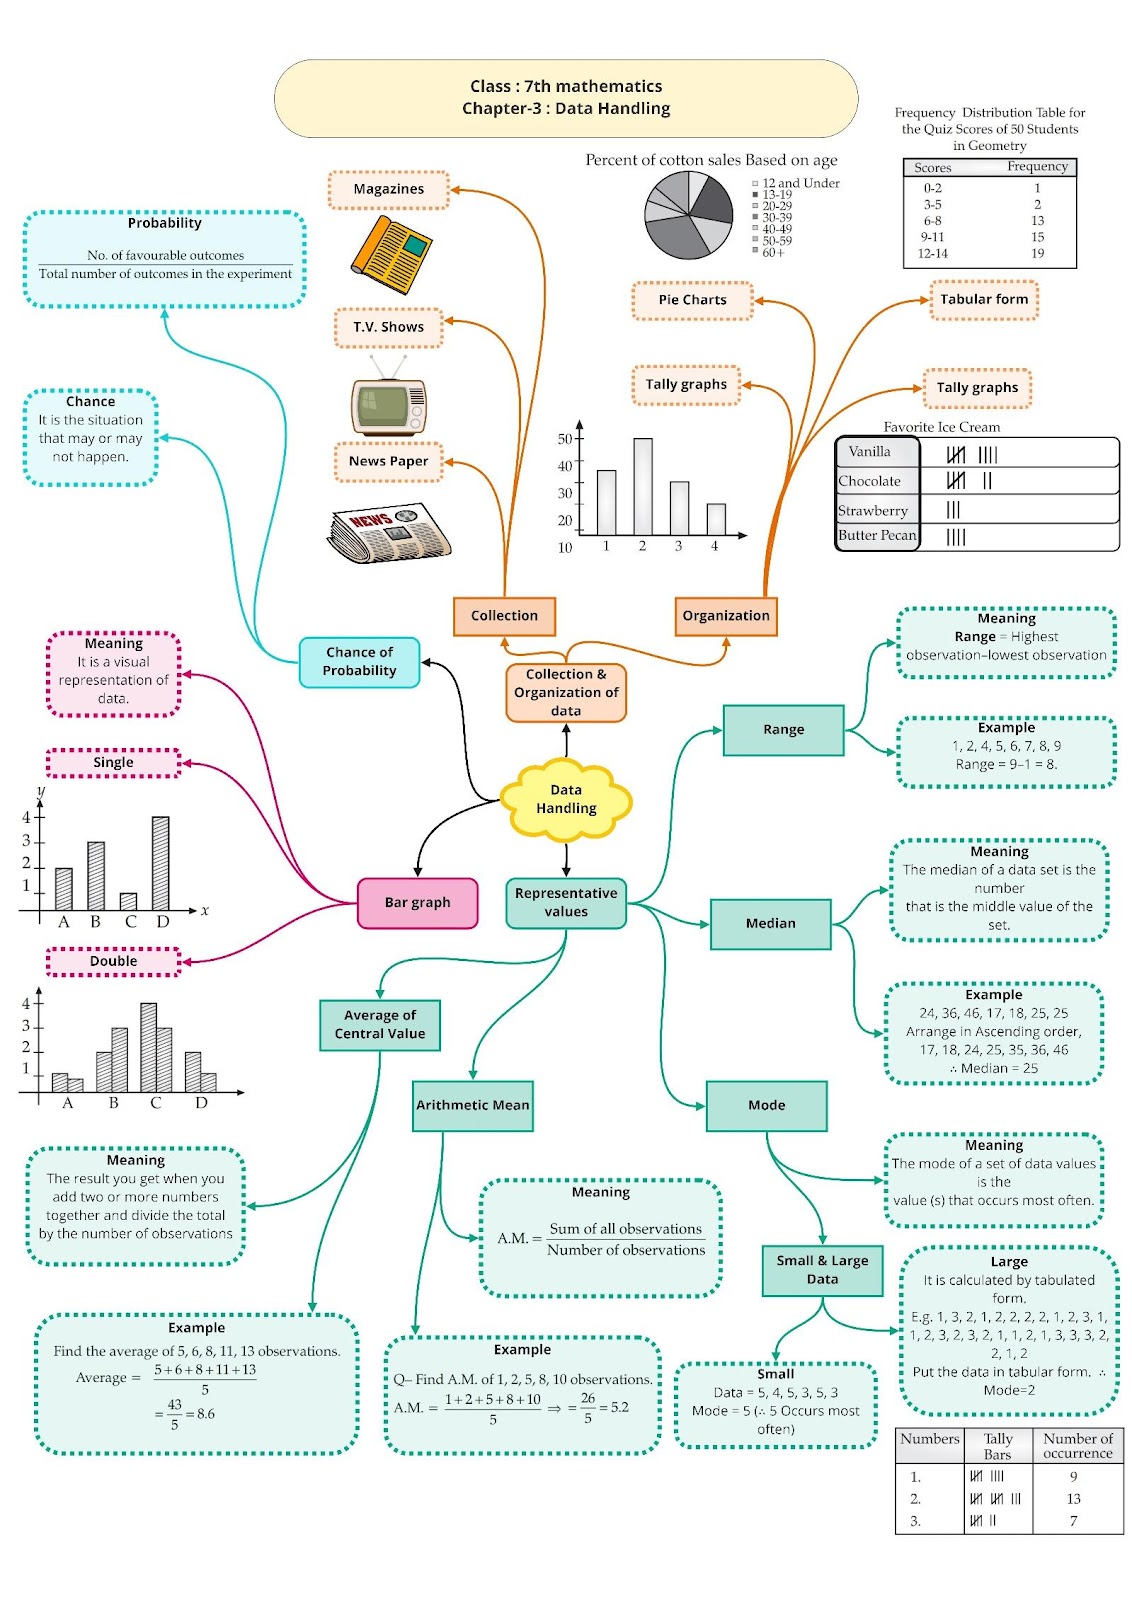
Data Handling
Double Bar Graphs
Double bar graphs are an effective tool to compare the values of two quantities for the same observation. For example, consider the marks obtained by five students of a class in two tests. Using a double bar graph, we can analyses which week students had better marks. Double Bar Graphs
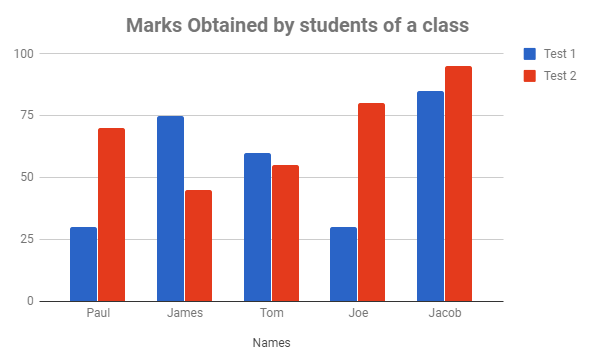
Double Bar Graph
You have seen what the bar graph of your expenses for the first week looks like. Say you continue this habit of tracking where you spent the money for some more time. You find that your week two expenses are slightly different from your first week. The details of the second-week expenses are;
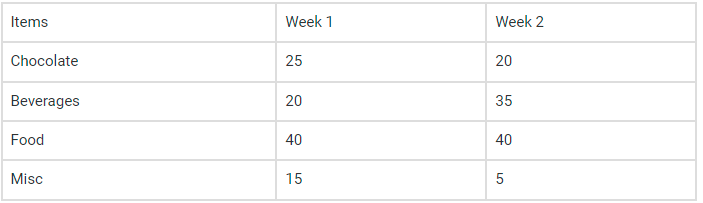
Since they all belong to the same group, they can be charted on the same bar graph. Remember that the same scale applies to all the data in the graph. Instead of charting them individually, you can place similar groups next to each other to compare the changes over a larger time span or over a larger range of data. Now plotting this together, we are better poised to see the differences between the weekly expenditure.
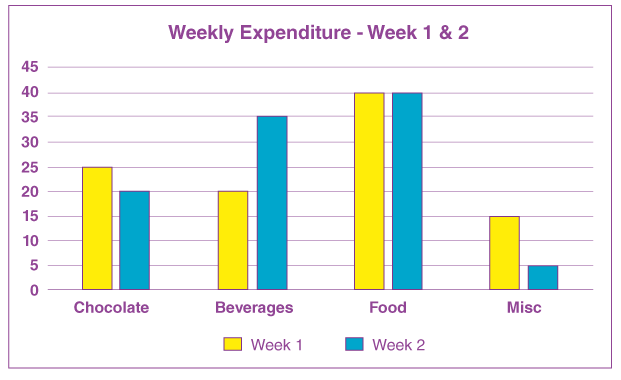
This process can also help you control your expenditure because you now know what you are spending the most on. Through this, you can judge whether your expenses are necessary.
Averages
The average is defined as the mean value which is equal to the ratio of the sum of the number of a given set of values to the total number of values present in the set.
Check: Mean Definition
The average formula has many applications in real life. Suppose if we have to find the average age of men or women in a group or average male height in India, then we calculate it by adding all the values and dividing it by the number of values.
Symbol
The average is basically the mean of the values which are represented by x̄. It is also denoted by the symbol ‘μ’.
Average Formula in Maths
The formula to find the average of given numbers or values is very easy. We just have to add all the numbers and then divide the result by the number of values given. Hence, the average formula in Maths is given as follows:
Average = Sum of Values/ Number of values
Suppose, we have given with n number of values such as x1, x2, x3 ,….., xn. The average or the mean of the given data will be equal to:
Average = x1+x2+x3+…+ xnn
Calculate Average
We can easily calculate the average for a given set of values. We just have to add all the values and divide the outcome by the number of given values.
Average can be calculated using three simple steps. They are:
Step 1: Sum of Numbers:
The first step in finding the average of numbers is to find the sum of all the given numbers.
Step 2: Number of Observations:
Next, we have to count how many numbers are in the given dataset.
Step 3: Average Calculation:
The final step in calculating the average is to divide the sum by the number of observations.
Now, let us consider an example to calculate the average.
If there are a group of numbers say, 20, 21, 23, 22, 21, 20, 23. Then find the average of these values.
By average formula, we know,
Average = Sum of valuesNo. of values
=20+21+23+22+21+20+237 / 7
=1507/7
= 21.42
Arithmetic Mean and Range
The average or arithmetic mean or mean of a given data is defined as :
Mean = Sum of all observations/Number of observations
The difference between the highest and the lowest observations in a given data is called its Range.
Example: Ages of all 10 teachers in grade 7 are: 25, 43, 34, 55, 44, 60, 32, 29, 35, 40.
Mean = 43 + 34 + 55 + 44 + 60, + 32 + 29 + 35 + 40 = 39.7 years
Range = Highest Observation – Lowest Observation = 60 – 25 = 35
Median
When a given data is arranged in ascending (or descending) order, then the middlemost observation is called the median of the data.
Example: Marks scored by seven students in a class are: 21, 32, 18 ,93, 21, 36, 50.
Observations in ascending order: 18, 21, 21, 32, 36, 50, 93.
Middle most value = 32
∴ Median is 32.
Mode
The mode of a set of observations is the observation that occurs most often.
Example: Given set of numbers: 1, 1, 2, 4, 3, 2, 1, 2, 2, 4
Ascending Order = 1, 1, 1, 2, 2, 2, 2, 3, 4, 4
∴ Mode of this data is 2 because it occurs more frequently.
Note: A data can have more than 1 mode.
Chance and Probability
Probability is the measure or the chance of occurrence of a particular event. Experiments which do not have a fixed result are known as random experiments.
Number of outcomes or Sample Space The set of all the possible outcomes to occur in any experiment is known as sample space.
Examples: Experiment: Tossing a coin, Sample Space (S) = {H,T}
Experiment: Rolling a die, Sample Space (S) = {1,2,3,4,5,6}
Favourable outcome – It is one of the possible result(s) of an experiment.
Examples: In an experiment of Tossing a coin, getting a head. Favourable outcome = {H} In an experiment of Rolling a die, getting an even number Favourable outcomes = {2, 4, 6} Probability of occurrence of any event,
PE=Number of favourable outcomes / Total Number of outcomes
Example: Find the probability of getting an even number when a die is rolled. Sample Space (S) = {1, 2, 3, 4, 5, 6}, Favourable outcomes = {2, 4, 6}
P(E)=Number of favourable outcomes / Total Number of outcomes =36=12
The Scale
Large numbers cannot be represented in a bar graph, so the scaling factor is used to reduce or scale down large numbers.
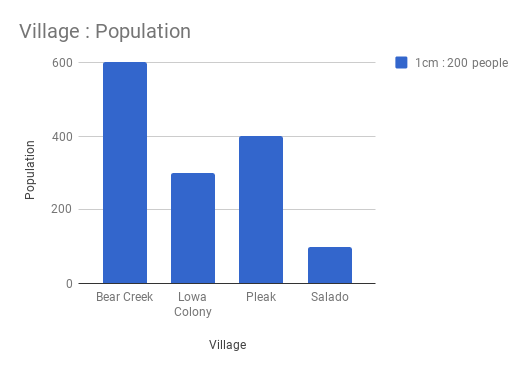
Bar graph showing the population in some villages
Example: The scale on the y-axis is 1 unit = 200 people.
Basics: The Right Data in the Right Form
Introduction: Data
Data are individual pieces of information, information about a particular system. They can be in the form of figures or numbers. Data is collected to analyse specific information for a specific purpose.
Organization of Data
Data is organised and represented graphically so that it becomes easy to understand and interpret. This is called an organisation of data.
Pictographs and Bar Graphs
A pictograph is a pictorial representation of data. Here data is represented using images of the objects.
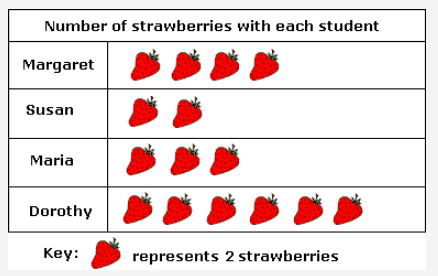
Pictographs
The graphical representation of data using bars of uniform width drawn vertically or horizontally with different lengths is called as bar graphs/bar diagrams. Bar diagrams consist of two axes: X-axis and Y-axis. The following is a bar graph showing the birthday of students in a class. Graph showing the birthday of students in a class.
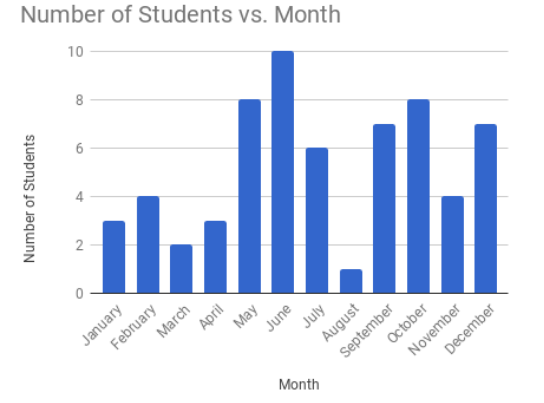
Bar Graph
Pictorial representation of data is called pictograph. As humanity flourished and the population increased, so did the amount of trade and transaction in the world. Ultimately, the amount of data is also increased. The merchants found it harder to keep track of the money flowing in and out of their coffers. When the population was little, trade was fairly simple but keeping track of who owes whom how much (data), so on and so forth became extremely tedious. To this end, the merchants created a bar graph with which they were able to depict a wide variety of information pictorially which not only helped understanding but also made it easier from a merchant’s point of view. What is the Bar Graph? Let’s find out.
Pictorial Representation Using Bar Graph
A bar graph also known as a bar chart is a chart that presents data that is grouped into rectangular bars. Here the length of the bar is directly proportional to the values they represent. The bar graph can be drawn vertically or horizontally. A vertical bar graph is known as a Column Bar Graph. Since one bar graph can be used to display multiple groups of data on the same graph, bar graphs can also be used as comparative tools where the length of the rectangular bar represents the value of each category. Since the rectangular bars are proportional, their differences can be spotted much more easily, visually than through words. Let’s take a closer look at bar graphs.
Say you have pocket money of 100 rupees every week. You are allowed to spend this amount any which way you want to. You use this money to buy chocolate, beverages, food and other miscellaneous toys and stuff. What you notice is that every week, the money just seems to disappear. You ask your father for a little more money but he instead suggests that you see where the money is going so that you can learn the value of money. To this end, you grudgingly make a bar chart. But to create a bar chart, you need to have data. You need to note down the things you are spending money on and how much. After a week you have the details of this week’s expenditure and they look something like this
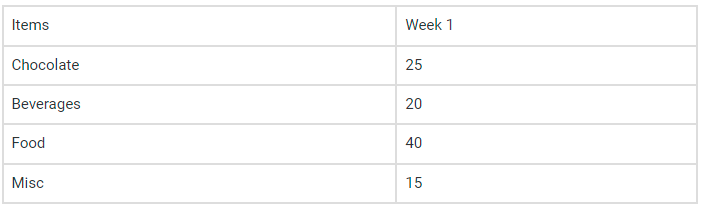
The first thing to observe is how the data is grouped. It is the first step to creating a bar graph. Similar expenses such as chocolates, candies, chewing gums are all grouped together. The same applies to the variety of soft drinks you consume. While discussing a bar graph, it was mentioned that the values are represented as a rectangular bar where the length of the rectangular bar is proportional to the value of the data. Here is where another characteristic of a bar graph comes into play.
Example
A Bar Graph needs to have a uniform scale. The scale dictates the conversion of the data in number into the rectangular format. A bar graph is the representation of numbers using bars of uniform width and length dependent on the number.
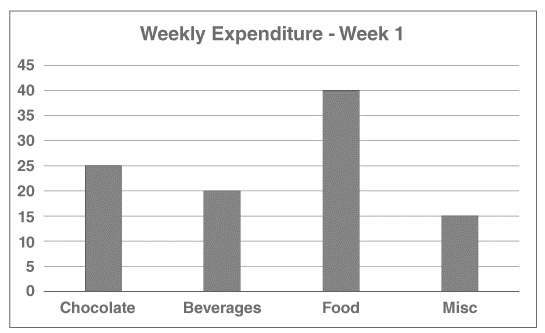
For example, if you represent the money you spent on chocolate using a 25 cm long rectangular bar then the scale is 1 rupee is equal to one unit on the graph i.e. one rupee is represented by one centimeter. But you can clearly see that for this type of representation you will need a massive graph. The thing about scale is that it is completely under our control. So instead of 25 cm, you can represent the same quantity with a rectangular bar of length 25 millimeters and here the scale is 10 rupees is equal to the same one unit i.e. 10 rupees is represented by the same one centimeter.
The interpretation of data is heavily reliant on accurate information about the scale, therefore, it is extremely important to mention the scale of your graph along both the x-axis and y-axis. Using the latter scale i.e. 10 rupees is equal to one centimeter. It is important to remember that the same scale is applied to all the groups of data in the bar graph.
Properties of Bar Graph
- The width of each bar or column in a bar graph must be equal
- The base of the bars is common in a bar graph
- The height of bars represents the data in the bar graph, proportionally
The bars can be drawn horizontally or vertically based on the given data
Important Questions
Multiple Choice Questions:
Question 1. The difference between the upper and lower limit is called
- group
- class size
- class interval
- class mark
Question 2. A process which results in some well defined outcome is known as:
- outcome
- event
- experiment
- frequency
Question 3. What is the median of the data 46, 64, 87, 41, 58, 77, 35, 90, 55, 33, 92?
- 87
- 77
- 58
- 60.2
Question 4. In a bar chart, a bar of length 4 cm is drawn. If 1 cm = 1.5 l, what will 4 cm be?
- 3 l
- 6 l
- 5 l
- 9 l
Question 5. The mean weight of 100 students in a class is 46 kg. The mean weight of boys is 50 and of girls is 40 kg. Therefore, the number of boys is:
- 50
- 60
- 70
- 65
Question 6. The probability of an experiment cannot be greater than :
- 0
- 0.5
- 1
- 2
Question 7. The number of times an observation occurs in a data is called its:
- Range
- Raw data
- Interval
- Frequency
Question 8. When a coin is thrown, total number of possible outcomes is ______.
- 5
- 2
- 6
- None of these
Question 9. The mean of 6, y, 7, x and 14 is 8. Which of the following is true?
- x + y = 13
- x − y = 13
- 2x + 3y = 13
- x2 + y = 15
Question 10. If 1 cm = 15 students, what will be the length of line for 90 students ?
- 4 cm
- 6 cm
- 6 students
- 9 cm
Question 11. The mean of five numbers is 27. If one of the numbers is excluded, the mean gets reduced by 2. What is the excluded number?
- 35
- 27
- 25
- 40
Question 12. Find the mean if the sum of 18 observations is 90.
- 5
- 4
- 6
- 9
Question 13. The arithmetic mean of five given numbers is 85. What is their sum?
- 425
- 85
- A number between 85 and 425.
- A number greater than 500.
Question 14. Two dice are thrown, find and number of outcomes.
- 12
- 6
- 36
- None of these
Question 15. How many possible outcomes can we get if we toss a coin and throw a dice respectively?
- 6, 2
- 2, 6
- 1, 3
- 3, 1
Very Short Questions:
- Find the range of the following data:
21, 16, 30, 15, 16, 18, 10, 24, 26, 2
- Find the mode of the following data:
24, 26, 23, 26, 22, 25, 26, 28
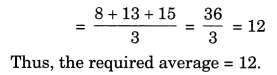
- Find the average of the numbers 8, 13, 15.
- Find the median of the following data:
8, 6, 10, 12, 14
- Find the median of the following data:
20, 14, 6, 25, 18, 13, 19, 10, 9, 1
- A fair die is rolled, find the probability of getting a prime number.
- If the averages of the given data 6, 10, 12, x, 16 is 14, find the value of x.
- Find the mean of the first 5 multiples of 3.
Short Questions:
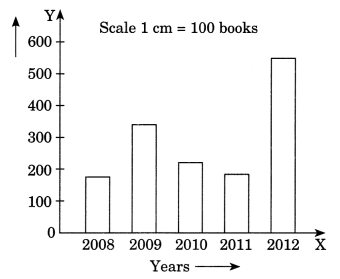
- The following bar graph shows the number of books sold by a publisher during the five consecutive years. Read the bar graph and answer the following questions:
(i) About how many books were sold in 2008, 2009 and 2012 years?
(ii) In which years were 575 books were sold?
(iii) In which years were the minimum number of books sold?
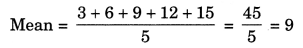
- Find the mean and median of first five prime numbers.
- The marks obtained (out of 10) by 80 students in a class test are given below:
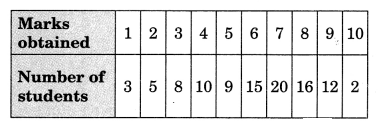
Find the mode of the above data.
- A bag contains 5 white and 9 red balls. One ball is drawn at random from the bag. Find the probability of getting
(a) a white ball
(b) a red ball
- A dice is tossed once. Find the probability of getting
(i) a number 5
(ii) a number greater than 5
(iii) a number less than 5
(iv) an odd number
(v) an even number
(vi) a number greater than 6
Long Questions:
- The data given below shows the production of motorbikes in a factory for some months of two consecutive years.
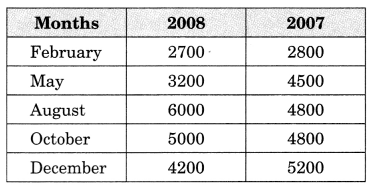
Study the table given above and the answer the following questions:
(a) Draw a double bar graph using an appropriate scale to depict the above information and compare them.
(b) In which year was the total output maximum?
(c) Find the mean production for the year 2007.
(d) For which month was the difference between the production for the two years is the maximum?
(e) In which month for the year 2008, the production was the maximum?
(f) In which month for the year 2007, the production was the least?
- A coin and a die are tossed once together. Find the total number of outcomes.
- Find the range of heights of any ten students of your class.
- Find the mean of the first five whole numbers.
- The marks (out of 100) obtained by a group of students in a science test are 85, 76, 90, 85, 39, 48, 56, 95, 81 and 75. Find the:
(i) Highest and the lowest marks obtained by the students.
(ii) Range of the marks obtained.
(iii) Mean marks obtained by the group.
Assertion and Reason Questions:
1) Assertion: The mean of the numbers 10, 20, 30 and 40 is 25.
Reason: Mean =10+20+30+404 =1004=25
a.) Both Assertion and Reason are correct and Reason is the correct explanation for Assertion
b.) Both Assertion and Reason are correct and Reason is not the correct explanation for Assertion.
c.) assertion is true but the reason is false.
d.) both assertion and reason are false.
2) Assertion: The middle most observation of a data series is called the median of the series.
Reason: medians divides the total frequency into 2 equal parts.
a.) Both Assertion and Reason are correct and Reason is the correct explanation for Assertion
b.) Both Assertion and Reason are correct and Reason is not the correct explanation for Assertion.
c.) assertion is true but the reason is false.
d.) both assertion and reason are false.
ANSWER KEY –
Multiple Choice Questions:
- (b) class size
- (c) experiment
- (c) 58
- (b) 6 l
- (b) 60
- (c) 1
- (d) Frequency
- (b) 2
- (a) x + y = 13
- (b) 6 cm
- (a) 35
- (a) 5
- (a) 425
- (c) 36
- (b) 2, 6
Very Short Answer:
- Greatest number 30
Smallest number = 10
Range = 30 – 10 = 20
- Arranging the given data with the same value together, we get
22, 23, 24, 25, 26, 26, 26, 28
Here, 26 occurs the greatest number of times i.e. 3 times
Thus, the required mode = 26.
- Let us arrange the given data in increasing order,
6, 8, 10, 12, 14
n = 5 (odd)
Median = n+12th term = 3rd term = 10
- Thus, the required median = 10.
Arranging the given data in increasing order, we get
6, 9, 10, 12, 13, 14, 18, 19, 20, 25
n = 10 (even)
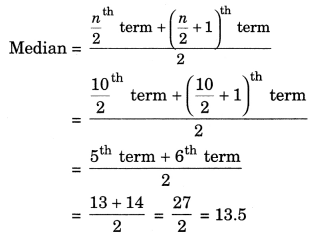
Thus, the required median = 13.5
- Number on a die = 1, 2, 3, 4, 5, 6
n(S) = 6
Prime numbers = 2, 3, 5
n(E) = 3
Probability =nEnS=36=12
Thus the required probability =12.
- Average of the given numbers
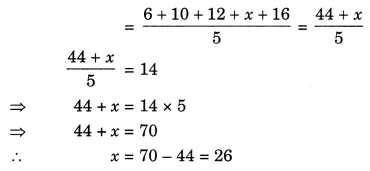
Thus, the required value of x is 26.
- Five multiples of 3 are 3, 6, 9, 12 and 15
Hence, the required mean = 9.
Short Answer:
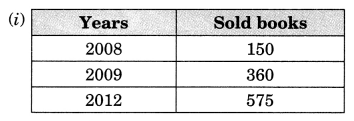
(ii) In the year of 2012, maximum number of books i.e. 575 were sold.
(iii) Minimum number of books i.e. 150 were sold in the year 2008.
- First five prime numbers are: 2, 3, 5, 7 and 11
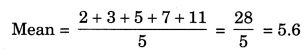
Here, n = 5
Median is the middle term, i.e., 5.
- In the given frequency distribution table, we find that the observation 7 has maximum frequency, i.e., 20
Hence, the required mode = 7.
- Total number of balls = 5 + 9 = 14 balls
n(S) = 14
(i) Number of white ball = 5
n(E) = 5
Probability of getting white ball =nEnS=514
(ii) Number of red balls = 9
n(E) = 9
Probability of getting white ball =nEnS=914
- Total number of outcomes = 6
n(S) = 6
(i) An event of getting a number 5
n(E) = 1
Probability =nEnS=16
(ii) An event of getting a number 5 greater than 5, i.e., 6
n(E) = 1
Probability =nEnS=16
(iii) An event of getting a number less than 5, i.e., 1, 2, 3 and 4.
n(E) = 4
Probability =nEnS=46=23
(iv) An event of getting an odd number, i.e., 1, 3 and 5.
n(E) = 3
Probability =nEnS=36=12
(v) An event of getting an even number, i.e., 2, 4 and 6.
n(E) = 3
Probability =nEnS=36=12
(vi) An event of getting a number greater than 6, i.e., Nil.
n(E) = 0
Probability =nEnS=06= 0
Long Answer:
- (a) Double bar graph
Scale : 1 cm = 100 Motor Bikes
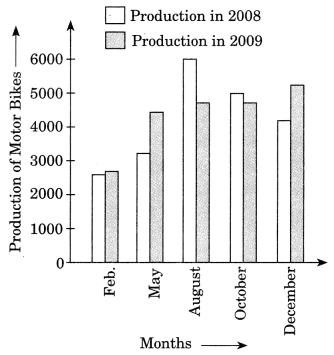
The above bar graph depicts the total production of motorbikes in two consecutive years.
Total production in 2007 was 22100 whereas in 2008 it was 21100.
(b) In the year 2007, the total production was maximum (22100)
(c) Mean production in the year 2007 is
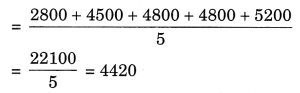
(d) Production of motorbikes in the May 2007 = 4500 and in May 2008 = 3200
Difference = 4500 – 3200 = 1300 which is the maximum
(e) In the month of August 2008, production was maximum i.e., 6000
(f) In the month of Feb. 2007 the production was least i.e., 2800.
- A coin has two faces, Head (H) and Tail (T)
A die has six faces marked with numbers 1, 2, 3, 4, 5, 6
Possible outcomes are:
H1, H2, H3, H4, H5, H6, T1, T2, T3, T4, T5, T6
Total number of outcomes = 2 × 6 = 12.
- Let the heights (in cm) of 10 students of our class be
125, 127, 132, 133, 134, 136,138, 141, 144, 146
Highest value among these observations = 146
Lowest value among these observations = 125
Range = Highest value − Lowest value
= (146 − 125) cm
= 21 cm
- First five whole numbers are 0, 1, 2, 3, and 4.
Mean = 0+1+2+3+45=105=2
Therefore, the mean of first five whole numbers is 2.
- The marks obtained by the group of students in a science test can be arranged in an ascending order as follows.
39, 48, 56, 75, 76, 81, 85, 85, 90, 95
(i) Highest marks = 95
Lowest marks = 39
(ii) Range = 95 − 39
= 56
(iii) Mean marks =85+76+90+85+39+48+56+95+81+7510
=73010=73
Assertion and Reason Answers:
- a.) Both Assertion and Reason are correct and Reason is the correct explanation for Assertion
- b.) Both Assertion and Reason are correct and Reason is not the correct explanation for Assertion.